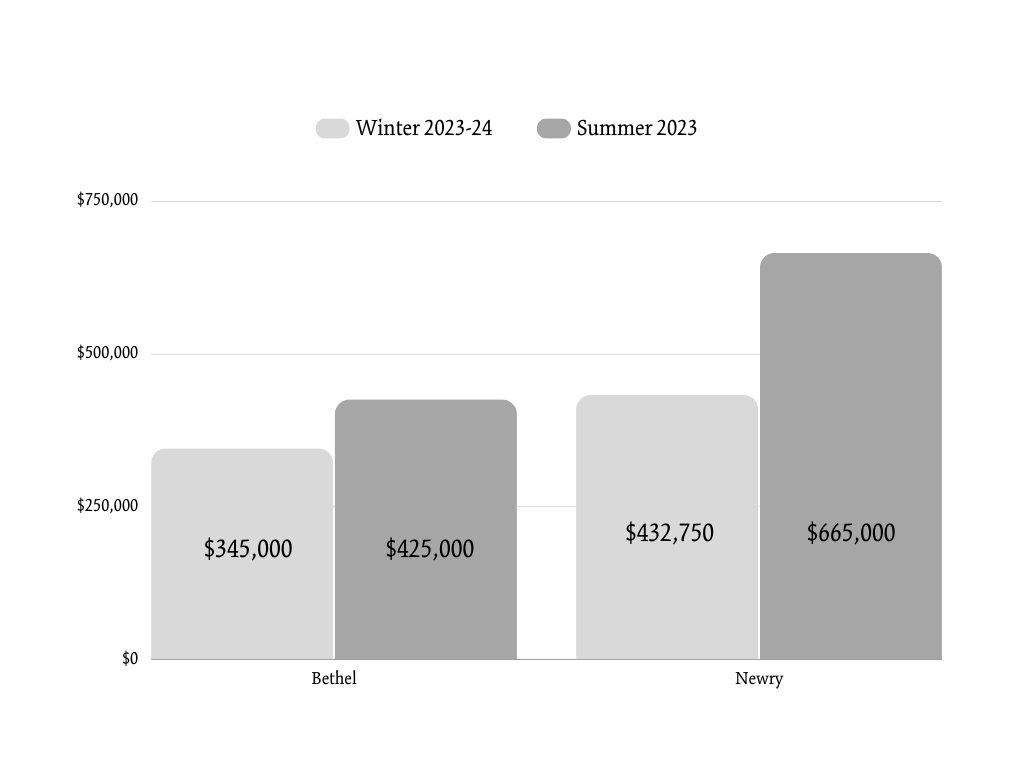
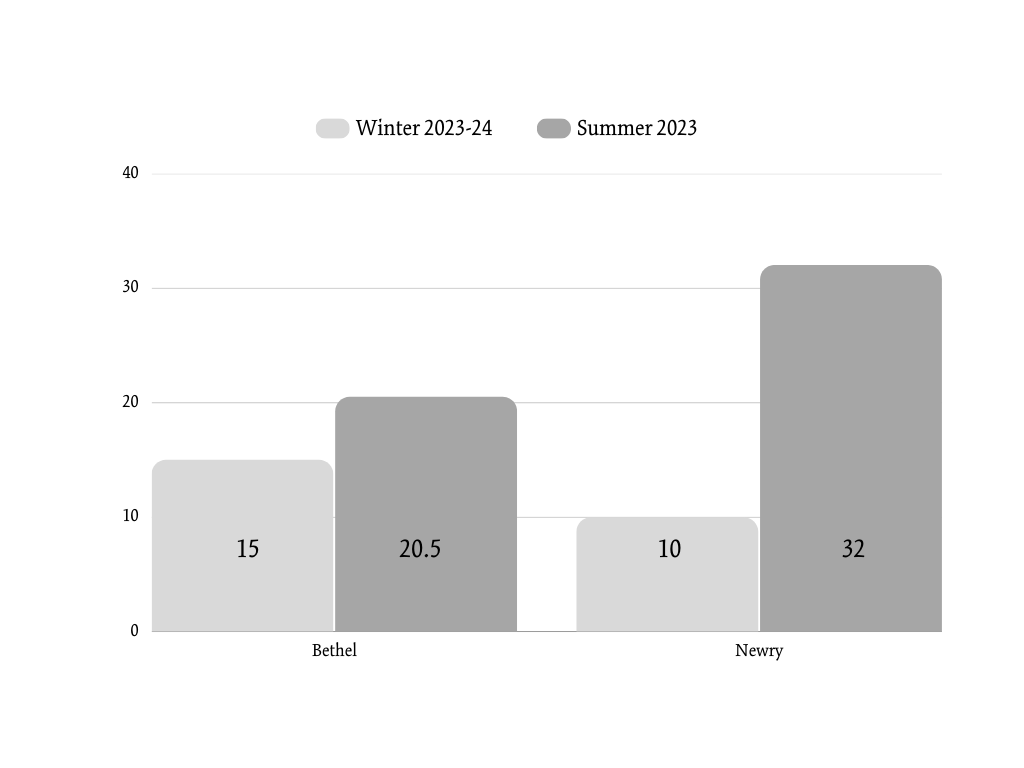
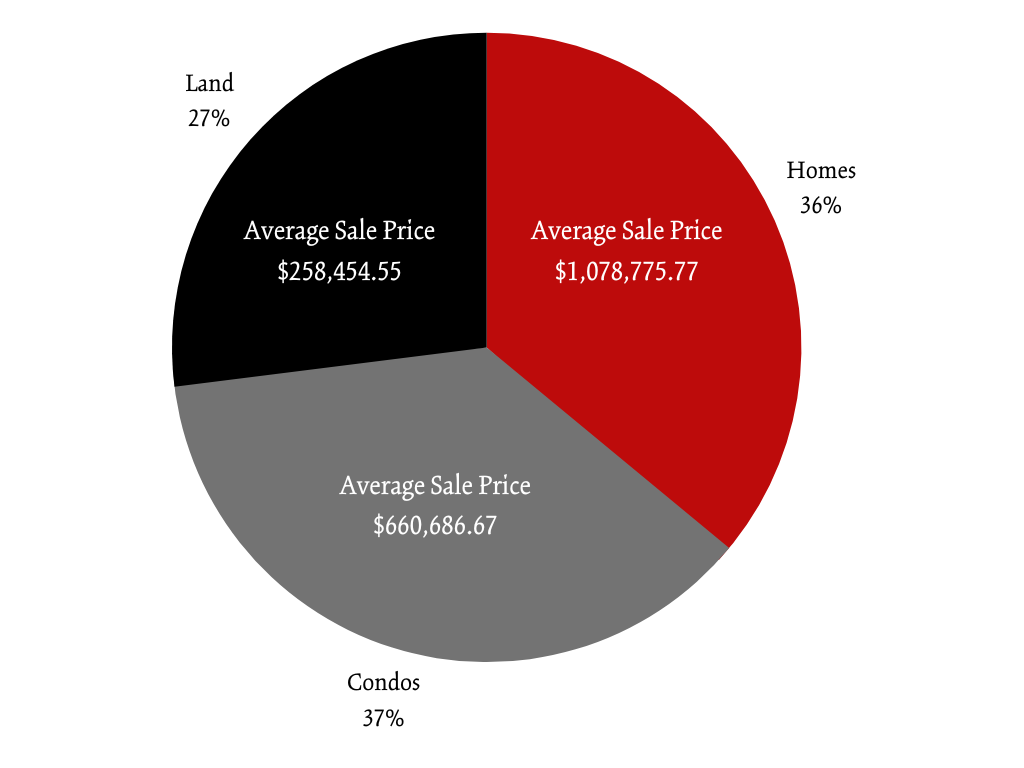
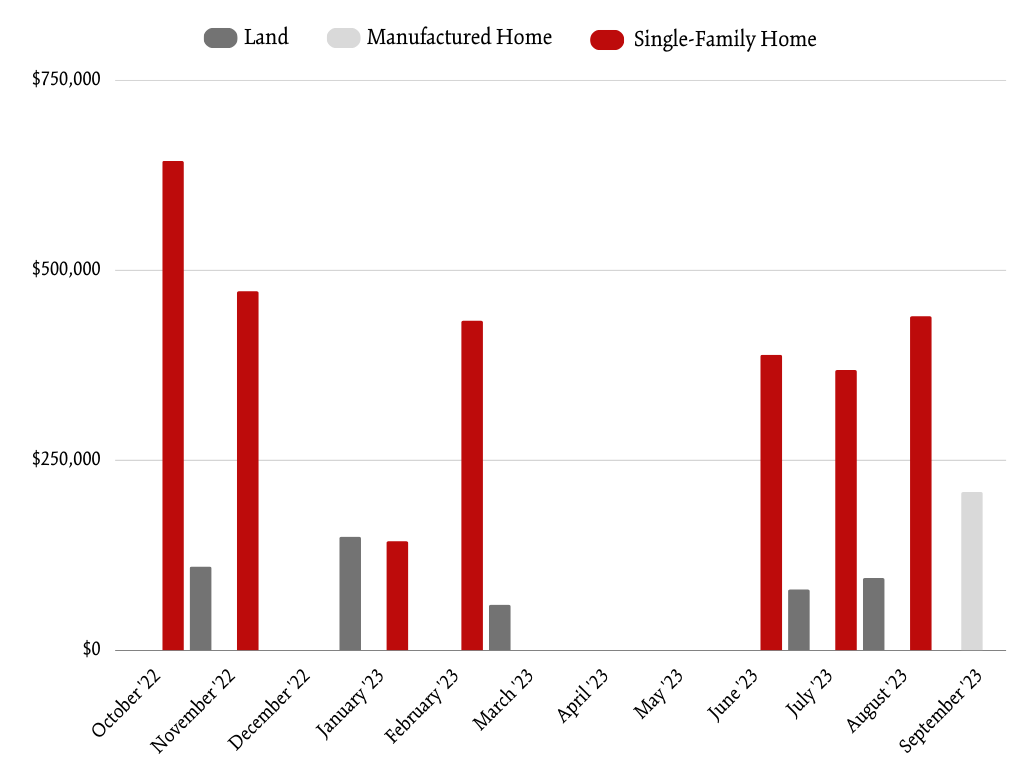
2023 Summer Market Report

April through September 2023

Sunday River Real Estate Market

MEDIAN SALES PRICE

Dollar for Median Sale Price

$400k

Up 12.67% from Winter 2022-23

DAYS ON MARKET

House for Days on Market

19

Up 18.75% from Winter 2022-23

CLOSED SALES

Key for Closed Sales

129

Down 4.44% from Winter 2022-23

The Sunday River region continues to be a highly desirable destination and place to settle. In this report, we will examine market trends from the past six months (April 2023 through September 2023) compared to the previous six months (October 2022 to March 2023) for Bethel, Newry, Greenwood, Bryant Pond, Woodstock, and Hanover.

Limited Inventory Drives Prices and Demand

Low inventory is driving demand for single-family homes, condominiums, and townhomes in Bethel and Newry. While the median number of days on the market has increased, which is typical during the off-season, the median sales price for Summer 2023 is up over Winter 2022-23.

Market Trends

Median Sales Price

Median Sales Price

Median Days on Market

Median Days on Market

Outlook

As we move into Fall 2023, we are hopeful for inventory to increase. However, given the current market conditions, buyers are advised to act quickly and decisively when they find a property they are interested in. Sellers, on the other hand, are well-positioned to command top dollar for their homes.

How We Can Help

As the official agency of Sunday River, and serving the greater Bethel, Maine, region, we are here to help you navigate this tricky market for both buyers and sellers. Our expert team of brokers has the experience and knowledge you need to succeed in your real estate goals. Contact us today to learn more.

Contact us today to consult with our expert team of brokers and learn more about how we can help you buy or sell a home in the Sunday River region.

Agency Listings
Contact Us

Newry

Newry, Maine Map

Comparative Statistics

ALL PRICE POINTSWINTER 22-23SUMMER 2023+/- CHANGE
Median Sale Price$432,750.00$665,000.00+53.66%
Median Price Per SQFT$423.99$461.60+8.87%
Median Days on Market1032+220.00%
Total Properties Sold3641+13.88%
Highest Sale Price$1,465,000.00$2,082,136.58+42.12%
% Sold to List Price100%98.86%-1.14%

Winter stats contain data from October 1, 2022 through March 31, 2023. Summer stats contain data from April 1, 2023 through September 30, 2023.. All data from the Maine MLS. 

Summer 2023 Percent of Market

newry pie chart

Average Sales Price

Newry AVG Sale Price Per Month
View Newry Listings

Bethel, ME

Bethel

Comparative Statistics

ALL PRICE POINTSWINTER 22-23SUMMER 2023+/- CHANGE
Median Sale Price$345,000.00$425,000.00+23.18%
Median Price Per SQFT$257.54$290.22+23.68%
Median Days on Market1520.5+36.66%
Total Properties Sold6662-6.06%
Highest Sale Price$1,200,00.00$1,050,000.00-12.5%
% Sold to List Price98.02%100.00%+2.02%

Winter stats contain data from October 1, 2022 through March 31, 2023. Summer stats contain data from April 1, 2023 through September 30, 2023.. All data from the Maine MLS. 

Summer 2023 Percent of Market

bethel pie chart

Average Sales Price

Bethel AVG Sale Price Per Month
View Bethel Listings

Greenwood, ME

Greenwood Map

Comparative Statistics

ALL PRICE POINTSWINTER 22-23SUMMER 2023+/- CHANGE
Median Sale Price$497,967.50$280,000.00-43.77%
Median Price Per SQFT$221.96$281.33+26.78%
Median Days on Market197-63.15%
Total Properties Sold1415+7.14%
Highest Sale Price$1,162,500.00$639,544.00-44.98%
% Sold to List Price96.67%100.00%+3.44%

Winter stats contain data from October 1, 2022 through March 31, 2023. Summer stats contain data from April 1, 2023 through September 30, 2023.. All data from the Maine MLS. 

Summer 2023 Percent of Market

Greenwood Percent of Market Pie Chart

Average Sales Price

Greenwood AVG Sale Price Per Month
View Greenwood Listings

Bryant Pond & Woodstock, ME

Bryant Pond/Woodstock Map

Comparative Statistics

ALL PRICE POINTSWINTER 22-23SUMMER 2023+/- CHANGE
Median Sale Price$300,000.00$208,500.00-30.5%
Median Price Per SQFT$209.31$210.23-0.43%
Median Days on Market59.56-89.91%
Total Properties Sold168-50.00%
Highest Sale Price$865,000.00$676,500.00-21.79%
% Sold to List Price95.87%103.15%+7.67%

Winter stats contain data from October 1, 2022 through March 31, 2023. Summer stats contain data from April 1, 2023 through September 30, 2023.. All data from the Maine MLS. 

Summer 2023 Percent of Market

Woodstock_BP Percent of Market Pie Chart

Average Sales Price

Woodstock_BP AVG Sale Price Per Month
View Bryant Pond & Woodstock Listings

Hanover, ME

Hanover map

Comparative Statistics

ALL PRICE POINTSWINTER 22-23SUMMER 2023+/- CHANGE
Median Sale Price$239,900.00$90,300.00-62.35%
Median Price Per SQFT$104.67$259.11+147.54%
Median Days on Market2757+111.11%
Total Properties Sold330.00%
Highest Sale Price$434,00.00$825,500.00+90.20%
% Sold to List Price100.00%100.00%0.00%

Winter stats contain data from October 1, 2022 through March 31, 2023. Summer stats contain data from April 1, 2023 through September 30, 2023.. All data from the Maine MLS. 

Summer 2023 Percent of Market

Hanover Percent of Market Pie Chart

Average Sales Price

Hanover AVG Sale Price Per Month
View Hanover Listings

Get in Touch